Tuesday, 31 May 2022
Sunday, 29 May 2022
Look Here First
Before entries follow the three step, a pending order at OB wont work and even than price can hit SL, use stop loss.
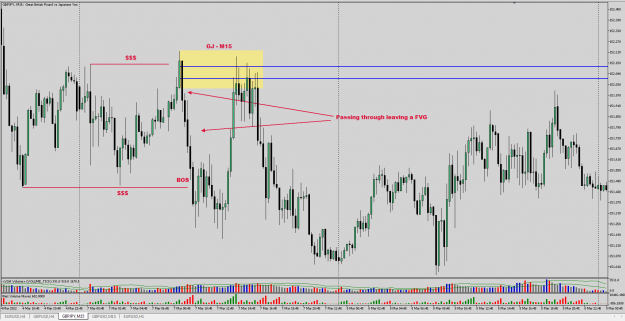
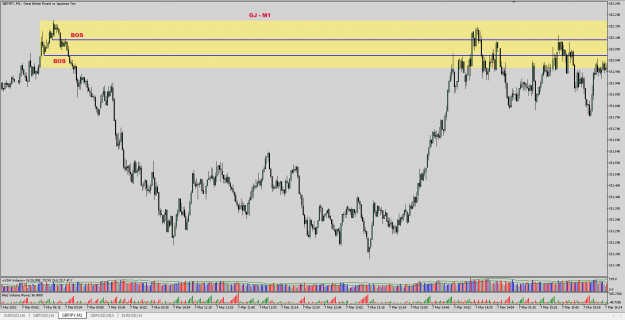
1. look for a liquidity grab / Imbalance rebalance2. wait for a BOS (break of structure) with a FVG
3. then Retest of OB (order block) is our entry.
..................................................
ICT defines the two major time zones as:
(1) London 0200 hrs. - 0500 hrs. NY Time
(2) New York 0700 hrs. - 1000 hrs. NY Time
I believe he defines the Asian time zone as 2300 hrs. - 0200 hrs. NY Time.
Keep in mind that he is not saying these are the only times the markets are open, these are just the times when he is looking to see what he is looking to see (FVGs, Liquidity Runs, Market Structure Points, Significant Highs and Lows, etc.)
And for the indices, he would also include 0830 hrs. - 1200 hrs. NY Time. and 1330 hrs. - 1615 hrs. NY Time.
(1) London 0200 hrs. - 0500 hrs. NY Time
(2) New York 0700 hrs. - 1000 hrs. NY Time
I believe he defines the Asian time zone as 2300 hrs. - 0200 hrs. NY Time.
Keep in mind that he is not saying these are the only times the markets are open, these are just the times when he is looking to see what he is looking to see (FVGs, Liquidity Runs, Market Structure Points, Significant Highs and Lows, etc.)
And for the indices, he would also include 0830 hrs. - 1200 hrs. NY Time. and 1330 hrs. - 1615 hrs. NY Time.
-----------------------
To simplify - If one wants to trade
1) London killzone - start looking trading opportunities 7am London time - 1h before official session open and be aware that alot more volume comes in when it opens officialy - (8am London Local Time).
2) If one wants to trade NY killzone - start looking trading opportunities 7am NY time - 1h before official session open and be aware that alot more volume comes in when it opens officialy - (8am NY Local Time).
Also with NY gotta keep in mind NY Stock Exchange open, (09:30 local NY time) - even more volume. So NY has kind of like a 2 official sessions.
If theres no opportunities on first hour of the killzone then one can wait for official session open to look for more/cleaner confirmations and being aware that first session official hour can be trap move (but not always, sometimes also countinuation) to get traders on the wrong side of the market.
1) London killzone - start looking trading opportunities 7am London time - 1h before official session open and be aware that alot more volume comes in when it opens officialy - (8am London Local Time).
2) If one wants to trade NY killzone - start looking trading opportunities 7am NY time - 1h before official session open and be aware that alot more volume comes in when it opens officialy - (8am NY Local Time).
Also with NY gotta keep in mind NY Stock Exchange open, (09:30 local NY time) - even more volume. So NY has kind of like a 2 official sessions.
If theres no opportunities on first hour of the killzone then one can wait for official session open to look for more/cleaner confirmations and being aware that first session official hour can be trap move (but not always, sometimes also countinuation) to get traders on the wrong side of the market.
-----------------------
..............
Feel free to build/develop Your own system that You like, only a certain type of price behaviour You wanna see, that You know that fits Your personality and only trade that what You can see, what might work for me might not suit for You.
ICT talked about Your "bread & butter" setup constantly in hes older videos thats uniquely Yours in its own way - once it clicks and once You find it/develop it further, then You only know what Youre looking for .. like you see it, its there and thats all You need, just 1 move Youre looking for and that 1 move can build Youre whole trading career! Be it OTE, Judas swing, higher timeframe breaker block setup, only a certain session liquidity grab followed by LTF BOS & retest, daily candle raid, LTF equal lows/high liquidity range setup, whatever it is. Go find it, backtest, forwardtest and make it uniquely Yours that You can follow and take without hesitation!
...............
To see what I am talking about requires you to spend some time on the charts, like I did, and look at the OB on the HTF and zoom into LTFs to see the BOS. I went further to also look at the tick charts.
How did I reach to the conclusion of the Order Block and Break of Structure?
I studied the BOS more on this thread (and other sources) and I was satisfied with it as a tool that I can use. As for the OB theory I knew it for a long time but I wasn't satisfied with it. I believe earlier on this thread I questioned the OB as a strong tool to use (as it is not respected at times). So I sat down and highlighted an OB where price returned to and respected it (on a HTF). Then I zoomed down to LTF to see what is happening around that OB and I took notes of what I saw. The obvious things I noted - liquidity grab (some), displacement, FVG, the BOS and where it happens (near Support/Resistance).
The first thing you need to understand is the meaning of an OB.
ICT defines a Bullish OB as:
1. The Lowest Candle or Price Bar with a Down Close (bearish);
2. That has the most range between Open and Close;
3. And is near a "Support" level.
He goes further and say its validation is when that Last Candle or Bar is traded through by a later formed Candle/Bar. In terms of Price Action you can see a breakout from that Last Candle/Bar (it doesn't have to be one opposite candle/bar - it can be many opposite candle/bars). You want to see a displacement that follows that Last Candle/Bar. In a BOS price breaks through the previous Low or High (a displacement).
Take this knowledge about the OB and combine it with the BOS that is explained on this thread and use the HTFs and LTFs to see my conclusion. Like I said even ICT briefly mentioned it on one of his series videos.
Bear in mind of the fractal nature of the market - a wave is subdivided into smaller waves and so on and so on. Also a Candle/Bar in HTF is is divided into candles/bars which can be seen in LTFs.
For an illustration just pick an OB in a HTF (preferably H1 and above) and show me the pair and time-frame and then I will break it down for you. I don't want to select an OB and show you the break-down to suit what I'm saying. Note if the OB candle/bar has a wick (and/or the candle prior) you are highly likely to see a BOS of the lower degree. So to make it harder for me choose an OB candle/bar (and prior candle/bar) with no wick for price to pass through. Why select from a HTF? I don't have past tick data to break it down any further below M1.
The best way for you to see all of this is through spending some time on the charts (research and practice, practice, practice). Always bear in mind of the fractal nature of the market.
How did I reach to the conclusion of the Order Block and Break of Structure?
I studied the BOS more on this thread (and other sources) and I was satisfied with it as a tool that I can use. As for the OB theory I knew it for a long time but I wasn't satisfied with it. I believe earlier on this thread I questioned the OB as a strong tool to use (as it is not respected at times). So I sat down and highlighted an OB where price returned to and respected it (on a HTF). Then I zoomed down to LTF to see what is happening around that OB and I took notes of what I saw. The obvious things I noted - liquidity grab (some), displacement, FVG, the BOS and where it happens (near Support/Resistance).
The first thing you need to understand is the meaning of an OB.
ICT defines a Bullish OB as:
1. The Lowest Candle or Price Bar with a Down Close (bearish);
2. That has the most range between Open and Close;
3. And is near a "Support" level.
He goes further and say its validation is when that Last Candle or Bar is traded through by a later formed Candle/Bar. In terms of Price Action you can see a breakout from that Last Candle/Bar (it doesn't have to be one opposite candle/bar - it can be many opposite candle/bars). You want to see a displacement that follows that Last Candle/Bar. In a BOS price breaks through the previous Low or High (a displacement).
Take this knowledge about the OB and combine it with the BOS that is explained on this thread and use the HTFs and LTFs to see my conclusion. Like I said even ICT briefly mentioned it on one of his series videos.
Bear in mind of the fractal nature of the market - a wave is subdivided into smaller waves and so on and so on. Also a Candle/Bar in HTF is is divided into candles/bars which can be seen in LTFs.
For an illustration just pick an OB in a HTF (preferably H1 and above) and show me the pair and time-frame and then I will break it down for you. I don't want to select an OB and show you the break-down to suit what I'm saying. Note if the OB candle/bar has a wick (and/or the candle prior) you are highly likely to see a BOS of the lower degree. So to make it harder for me choose an OB candle/bar (and prior candle/bar) with no wick for price to pass through. Why select from a HTF? I don't have past tick data to break it down any further below M1.
The best way for you to see all of this is through spending some time on the charts (research and practice, practice, practice). Always bear in mind of the fractal nature of the market.
It is not necessary to mark a daily candle and inside that h4, and H1 then m30 till m1
Simplest is mark htf only and wait price to reach there and see the reaction and capitalize it. I.e, weekly, daily, h4 or m15 choose any one you like.
What you have to mark:
- imbalances as price comes back to rebalance them, wait for a bos and return to ob is entry
- Order blocks, breaker blocks, as price sweeps them for Liquidity, but when respects wait for a bos and retrum to ob is entry (then price creates new imbalances)
Simplest is mark htf only and wait price to reach there and see the reaction and capitalize it. I.e, weekly, daily, h4 or m15 choose any one you like.
What you have to mark:
- imbalances as price comes back to rebalance them, wait for a bos and return to ob is entry
- Order blocks, breaker blocks, as price sweeps them for Liquidity, but when respects wait for a bos and retrum to ob is entry (then price creates new imbalances)
...............
Breaker
........................
Breaker @ daily
Breaker block follows a liquidity grab/successful swing.
Mitigation block follows a swing failure.
They were once Order Blocks that price has traded through, showing a potential change in delivery/market structure break.
They are both treated as PD Arrays along with Order Blocks, Fair Value Gaps etc etc, so could be considered as similair just a different narrative behind them.
Didn't get it. Please if anyone can understand it why price is not following the highlighted areas. It was confirmed a bearish move in daily trend.
trend line broken with impulse wave.
no bearish candle in breaker.
price later bounced up from breaker as support.
no bearish candle in breaker.
price later bounced up from breaker as support.
- show what is Breaker?
Keep every thing simple, mark m15 OB inside H4 OB and then see if price shows a BOS then upon return back to breaker or OB wait price to show FVG and enter at OB keeping SL above the OB as shown in this pic.
sometime Big FVG then what to do ?
Mark the FVG open and mid point and OBs and wait for the reaction as shown in above picture to look for entry.
means a simple image to mark OB wick /candle/FVG ?
Mark the OB candles only as bulk of volume lies in candles not wicks, but HTF wicks are important too.
how to know which is valid or stonger OB ?
OB where price has never visited before.
What stoploss has to use ? FVG ? or above high 1-2 pips and below low 1-2 pips ?
Pips doesn't matter it is your lot size adjustment so loss remain fixed, use EA attached in post #1 to find that lot size.
if there are 10 higher low in trend and market start reversal does i have to mark all those 10 Higher low as 10 OB ? or only 2-3 amongh those will mark ?
* marking is still big big confusion
- OB where price has never visited before (means those OB have FVG)
- Mark M15 OBs only inside H4 OBs
- Watch for the pattern picture for entries at:
Round Numbers / Half round number, 00, 20, 50, 80 levels
Above and below of yesterday / Weekly / Monthly
At Asian high / Low
At FVG open and at 50%
At OB open and at 50%
At Breaker open and at 50%
At 5 days daily ADR high low
*** Liquidity: at all these above levels is liquidity/mitigation/FVG balance is happening so only then we look for entries.
Mark the FVG open and mid point and OBs and wait for the reaction as shown in above picture to look for entry.
means a simple image to mark OB wick /candle/FVG ?
Mark the OB candles only as bulk of volume lies in candles not wicks, but HTF wicks are important too.
how to know which is valid or stonger OB ?
OB where price has never visited before.
What stoploss has to use ? FVG ? or above high 1-2 pips and below low 1-2 pips ?
Pips doesn't matter it is your lot size adjustment so loss remain fixed, use EA attached in post #1 to find that lot size.
if there are 10 higher low in trend and market start reversal does i have to mark all those 10 Higher low as 10 OB ? or only 2-3 amongh those will mark ?
* marking is still big big confusion
- OB where price has never visited before (means those OB have FVG)
- Mark M15 OBs only inside H4 OBs
- Watch for the pattern picture for entries at:
Round Numbers / Half round number, 00, 20, 50, 80 levels
Above and below of yesterday / Weekly / Monthly
At Asian high / Low
At FVG open and at 50%
At OB open and at 50%
At Breaker open and at 50%
At 5 days daily ADR high low
*** Liquidity: at all these above levels is liquidity/mitigation/FVG balance is happening so only then we look for entries.
Saturday, 28 May 2022
Mentor saying
Yes there is a secret trick ! but rarely people believe that it is the real secret. People think important is the method but it is not the method it is the secret + method without the secret no method will be successful.
The Secret:
what is the amount of $$ loss (not pips) we willing to lose from all our equity? what % it will be from our equity lost is the secret.
Unfortunately we dont use SL and assume price has to respect my entry always.
if you have the answer of above question, you will not need to ask how many pips will be my SL because the lot size will be choose by the EA i shared in post # 1 because your loss is fixed in terms of amount.
now if risk management is in place which needs alot of discipline.
How to develop discipline:
Use any prop firm demo account i.e. ftmo / mff to learn and practice that, only doing demo practice without any rules or discipline can only verify the method but with proper discipline one has to take challenges but unfortunately no one told me this but
Zoltan: https://www.forexfactory.com/profitfarmer
https://www.forexfactory.com/thread/...5#post13912185
Once we have the discipline trust me investors will be on your left and right people have funds but not skilled traders available, and at the least you can always use your own funds as the journey has taught us how to trade.
Why i emphasize prop fund is rather loosing your own 2k in real account split into 10 chances and buy a prop firm challenge account of 25K equity every time at nominal price of 100-155$. Upon meeting he required monthly profit target of 10% maintaining the 5% daily draw down, if achieved which will be 2500$ will be shared 80/20 so you will still get 2K by investing a small fee of 155$ (refundable upon first withdrawal) to get 25K equity at FTMO (which is even less at MFF).
The Method: it is ICT , my thread is only how i learn it from Michael and share it with you all here at Forex Factory.
Below link is of Mr Sajid Ahmed (from Pakistan) who withdraws 42000$ in last three days from MFF, isnt this amazing
https://www.facebook.com/10000248854...7821192136554/
Note: my thread is not important, same like the things around us in real life, it is the people who are important no matter at which thread they are.
Links:
FTMO: https://ftmo.com/en
MFF: https://myforexfunds.com/
For now focus should be on protecting and increasing equity by taking off half or 70% trade after 10-15 pips and let the balance be runner at Breakeven.
i started using RSI as SMT tool for me and only when one leg jumps into 85 to 70 or 15 to 30 then a signal trigger but subject to a BOS, hope it is clear why RSI is part of my system as at this point correlative currencies are in divergence and need a quick reaction. Even on any time frame but higher TF gives hugeeeeee R 2 R.
Find the nearest Bullish and Bearish Order Blocks on M15 or H1 and watch on M1 as Price approaches and enters the Order Block.
Look for Speed (Momentum) Structure (HH HL LL LH)
Take your time and watch Price and how it behaves at the end of the day it's what makes sense to you.....
Look for Speed (Momentum) Structure (HH HL LL LH)
Take your time and watch Price and how it behaves at the end of the day it's what makes sense to you.....
Look at the three Time Frames and look for Levels in M30 and wait for the return and Entry using M5 M1
Or any time frames use wish to use BUT always look for Levels within the Higher Time Frame
- price will not test an OB which has gap
- price will make equal high/low and will go away
- we wait for price to comes back take the equal high/low and land into the untested OB having the gap should be entry.
i wish it would be that straight forward but to understand the whole picture i follow the below steps: (my template is the same as in 1st post )
- what is the order flow. (look daily the D1 and H4 chart daily basis, and on weekend weekly/monthly as well for hindsight)
- what will be the next week range possible as per ADR, based on this range you need to see the below two things as per order flow.
- where are fair value gaps/imbalances/ price inefficiencies? in this range (gap between the wicks of two candles)
- where is the liquidity? (above and below of the swings and Eq highs/lows and sessions)
Note that some liquidity will be visible and some will be generated as the week starts
entries should be on M1, M5 after gaps are filled or liquidity is hunted based upon price action. breakers and order blocks are be aligned to fvg and liquidity.
- Time is also very important first three hours of every session i.e., asian, london newyork, including yesterday (some time is goes beyond two days as well) highs and lows,
- Friday, being the last day of the week and 30th,31st day being the last day of month and quarter, expect a reversal due to profit taking or a new trend)
- avoid trading before 1 hour of red news time.
- try to catch reversals in the direction of order flow/trend not the reversals against it because each entry is a risk the less entries are better and it gives room to stay relax and move away from charts as well.
Unfortunately Majority of people dont know how to trade, but still survives the market only by using the money management ... and very few knows how to trade and follows money management.
Below point must be the essentials of a good money management. (credits to Profitfarmer)
- position/lot/trade sizing based upon the available equity and risk willing to take.
- what is the risk per trade of your equity
- what is the risk on equity you willing to take per week before one stops trading.
- when to take the profit
- when to book the loss
- will you hedge the loss?
Trust that Demo account is your friend, practice with equity which you will going to start with and give it three months and see if you can survive or grow it and do it three times, and before that first 3 months of learning atleast so an easy 12 months package. remove the indicators moving averages, rsi, cci, obv .... trade naked chart. read a book on money management and securing your equity.
mean while these 12 months one should have a job / business to survive, Trust that God, the creator! has given everyone some skills, forex is not the only way to survive it if doesnt works for anyone it doesnt matter as life is full of opportunities, stay humble to what situation God has put each of us in.
- what is the order flow. (look daily the D1 and H4 chart daily basis, and on weekend weekly/monthly as well for hindsight)
- what will be the next week range possible as per ADR, based on this range you need to see the below two things as per order flow.
- where are fair value gaps/imbalances/ price inefficiencies? in this range (gap between the wicks of two candles)
- where is the liquidity? (above and below of the swings and Eq highs/lows and sessions)
Note that some liquidity will be visible and some will be generated as the week starts
entries should be on M1, M5 after gaps are filled or liquidity is hunted based upon price action. breakers and order blocks are be aligned to fvg and liquidity.
- Time is also very important first three hours of every session i.e., asian, london newyork, including yesterday (some time is goes beyond two days as well) highs and lows,
- Friday, being the last day of the week and 30th,31st day being the last day of month and quarter, expect a reversal due to profit taking or a new trend)
- avoid trading before 1 hour of red news time.
- try to catch reversals in the direction of order flow/trend not the reversals against it because each entry is a risk the less entries are better and it gives room to stay relax and move away from charts as well.
Unfortunately Majority of people dont know how to trade, but still survives the market only by using the money management ... and very few knows how to trade and follows money management.
Below point must be the essentials of a good money management. (credits to Profitfarmer)
- position/lot/trade sizing based upon the available equity and risk willing to take.
- what is the risk per trade of your equity
- what is the risk on equity you willing to take per week before one stops trading.
- when to take the profit
- when to book the loss
- will you hedge the loss?
Trust that Demo account is your friend, practice with equity which you will going to start with and give it three months and see if you can survive or grow it and do it three times, and before that first 3 months of learning atleast so an easy 12 months package. remove the indicators moving averages, rsi, cci, obv .... trade naked chart. read a book on money management and securing your equity.
mean while these 12 months one should have a job / business to survive, Trust that God, the creator! has given everyone some skills, forex is not the only way to survive it if doesnt works for anyone it doesnt matter as life is full of opportunities, stay humble to what situation God has put each of us in.
first level of TP can be yesterday high, since liquidity usually reside above/below yesterday high and lows and price turns from there, in todays scenario price is respecting yesterday high and did a BOS on the other side, and making lower highs, perhaps the intention is to push the prices to down side using FOMC.
Q: Why my entry points has to be perfect ??
Below are few points in my view:
1. I dont have plan to invest huge equity which is a general perception less equity one cannot make a living that's right but for people who don't know how to trade
2. not being arrogant to be honest, your broker will provide you the leverage to use small equity to move big money !! if you know how to trade.
3. only need 10 pips enough to make my day
4. always using SL and exit if price don't respect my side even if it does after 15 min. i don't care it has to respect or i am out i can book 25-50$ loss no problem, trust me if you cannot book losses trading is only a tension, because price can do anything.
5. like to book 100-300$ per entry.
6. finally i am a scalper in and out.
one entry a day is enough for me to get me 200-300$ and i am done, i don't need to swing from every nook and corner, let the price reverse, (don't mess with it let it reverse) and then upon pull back get in and get out and done !!
but to do this first learn the method then Demo practice it 1 and half year or 2, after that only think to invest your equity 1-2K what ever you want and keep the same equity on float, take out the profits one can do his living just scalping. that is my point of view, you don't need big equity and worry.
all you need is to first learn ! before you earn.
Done 300+$ i dont need to trade today this is for motivation only, and i will delete the picture before 24 hr i dont like to excites anyone for profits but to motivate for learning.
Below are few points in my view:
1. I dont have plan to invest huge equity which is a general perception less equity one cannot make a living that's right but for people who don't know how to trade
2. not being arrogant to be honest, your broker will provide you the leverage to use small equity to move big money !! if you know how to trade.
3. only need 10 pips enough to make my day
4. always using SL and exit if price don't respect my side even if it does after 15 min. i don't care it has to respect or i am out i can book 25-50$ loss no problem, trust me if you cannot book losses trading is only a tension, because price can do anything.
5. like to book 100-300$ per entry.
6. finally i am a scalper in and out.
one entry a day is enough for me to get me 200-300$ and i am done, i don't need to swing from every nook and corner, let the price reverse, (don't mess with it let it reverse) and then upon pull back get in and get out and done !!
but to do this first learn the method then Demo practice it 1 and half year or 2, after that only think to invest your equity 1-2K what ever you want and keep the same equity on float, take out the profits one can do his living just scalping. that is my point of view, you don't need big equity and worry.
all you need is to first learn ! before you earn.
Done 300+$ i dont need to trade today this is for motivation only, and i will delete the picture before 24 hr i dont like to excites anyone for profits but to motivate for learning.
few places you can wait for stop hunt, when price is around the following places during europe/new york sessions:
1. previous weeks high low
2. previous days high low
3. asia session high low
4. london session high low
5. new york session high low
1. previous weeks high low
2. previous days high low
3. asia session high low
4. london session high low
5. new york session high low
Really nice quality info!
If ITB agrees then I would like to add something that worked and completely changed my gameplan atleast.
- Ideally You wanna wait and enter where "other/retail" traders got stopped out, but not blindly immediately. Just like the first page here on this thread says -
"2. Wait of liquidity grab and BOS (break of structure)" and then use that area where liquidity got grabbed (OB/BB & FVG retest - inside the area where they had to manipulate the price in certain way/grab liquidity) for entry. Remember - You wanna get in when buyers/sellers or both got stopped out already but still participate with main order flow direction.
If trying to understand/practise something I think its best to know exactly why certain things happen, so:
keep in mind if "big players" wanna buy something X amount (assuming big orders) they first have to sell the same thing in order to create liquidity for themselves (so they can/are selling first to break significant key level just to buy it back up later - it triggers all the orders for breakout traders to start selling + buyers "sell" stops (SL) got triggered (If your buying something but this doesent work out and Your stop gets triggered - that means Your now selling it to someone along with breakout traders and most likely being part of "big players liquidity pool"). If they are doing it (buying/selling something big amount) immediately without grabbing liquidity/manipulating then the market would just move one way and average price for them is mostly too high/expensive - remember its a business like any other.
E.g if some "bank client" wants to exchange billions/millions of EUR TO USD (EURUSD) in with specific price range only, market will almost always come back to fill in these gaps and test that OB/BB (pick up these "clients" orders left on the table/order book) to then countinue to keep moving in certain direction.
Also make sure You are in right/significant HTF zone, I suggest looking minimum atleast 2-3 timeframes to be sure they all agree in (not neccessarily always in the same direction but just for the move Youre looking to make if you have exact ENTRY, SL & TP in mind). If you dont know exact TP where You plan to get out or if You are a new trader then its best for You to make all (HTF+LTF) timeframes agree with each other - trade with trend.
I personally avoid putting SL into equal highs/lows areas (where I can imagine most retail traders have their SL) unless thats some clear accumulation/distribution zone and someone is buying/selling/that exact level to the PIP/orders resting/level being defended - but thats topic for another time.
Im personally using and would also like to add/suggest keeping eye for liq. grabs on:
1) Daily open - also reading/paying attention to daily chart + daily candlestick patterns is very important and often underrated.
2) 4H candles - around open (mostly up to first hour, depends where key OBs & BBs are) & close.
3) NY stock exchange open (9:30 NY time big volume kicks in everyday - first "significant/big" move is almost always a fakeout/liquidity grab especially for indicies).
If ITB agrees then I would like to add something that worked and completely changed my gameplan atleast.
- Ideally You wanna wait and enter where "other/retail" traders got stopped out, but not blindly immediately. Just like the first page here on this thread says -
"2. Wait of liquidity grab and BOS (break of structure)" and then use that area where liquidity got grabbed (OB/BB & FVG retest - inside the area where they had to manipulate the price in certain way/grab liquidity) for entry. Remember - You wanna get in when buyers/sellers or both got stopped out already but still participate with main order flow direction.
If trying to understand/practise something I think its best to know exactly why certain things happen, so:
keep in mind if "big players" wanna buy something X amount (assuming big orders) they first have to sell the same thing in order to create liquidity for themselves (so they can/are selling first to break significant key level just to buy it back up later - it triggers all the orders for breakout traders to start selling + buyers "sell" stops (SL) got triggered (If your buying something but this doesent work out and Your stop gets triggered - that means Your now selling it to someone along with breakout traders and most likely being part of "big players liquidity pool"). If they are doing it (buying/selling something big amount) immediately without grabbing liquidity/manipulating then the market would just move one way and average price for them is mostly too high/expensive - remember its a business like any other.
E.g if some "bank client" wants to exchange billions/millions of EUR TO USD (EURUSD) in with specific price range only, market will almost always come back to fill in these gaps and test that OB/BB (pick up these "clients" orders left on the table/order book) to then countinue to keep moving in certain direction.
Also make sure You are in right/significant HTF zone, I suggest looking minimum atleast 2-3 timeframes to be sure they all agree in (not neccessarily always in the same direction but just for the move Youre looking to make if you have exact ENTRY, SL & TP in mind). If you dont know exact TP where You plan to get out or if You are a new trader then its best for You to make all (HTF+LTF) timeframes agree with each other - trade with trend.
I personally avoid putting SL into equal highs/lows areas (where I can imagine most retail traders have their SL) unless thats some clear accumulation/distribution zone and someone is buying/selling/that exact level to the PIP/orders resting/level being defended - but thats topic for another time.
Im personally using and would also like to add/suggest keeping eye for liq. grabs on:
1) Daily open - also reading/paying attention to daily chart + daily candlestick patterns is very important and often underrated.
2) 4H candles - around open (mostly up to first hour, depends where key OBs & BBs are) & close.
3) NY stock exchange open (9:30 NY time big volume kicks in everyday - first "significant/big" move is almost always a fakeout/liquidity grab especially for indicies).
We dont have to cheery pick these entries but anywhere with in the FVG near to an OB or breaker is a good entry.
Its as below:
1. look for a liquidity grab or Rebalance of an old Imbalance.
2. wait for a BOS (break of structure) with a FVG
3. then Retest of OB (order block) or inside fvg is our entry.
and since price is fractal same rules will apply on HTF.
1. look for a liquidity grab or Rebalance of an old Imbalance.
2. wait for a BOS (break of structure) with a FVG
3. then Retest of OB (order block) or inside fvg is our entry.
and since price is fractal same rules will apply on HTF.
whatever the time frames one looks at, and since they are all fractals, the basis of trading is:
that price gravitates or drawn to 2 places and they appear in all time frames:
1. stops. this is where liquidity lies.
2. imbalance. it has to be rebalanced or filled up.
that price gravitates or drawn to 2 places and they appear in all time frames:
1. stops. this is where liquidity lies.
2. imbalance. it has to be rebalanced or filled up.
d1 - high low swing as directional bias to take out stops.
h1 - a framework for looking at the w1 range.
m15 - before there is any significant price move, generally there is going to be a stop hunt at swing high low.
m5/4/3/2/1 - this is where most of us here are interested in, how to enter a trade.
look for market structure shift and retracement back to fair value gap.
since stops and imbalances appear all the time, all over the place, in all time frames, the time of the day that one trades is of utmost importance.
also never forget sound money management.
h1 - a framework for looking at the w1 range.
m15 - before there is any significant price move, generally there is going to be a stop hunt at swing high low.
m5/4/3/2/1 - this is where most of us here are interested in, how to enter a trade.
look for market structure shift and retracement back to fair value gap.
since stops and imbalances appear all the time, all over the place, in all time frames, the time of the day that one trades is of utmost importance.
also never forget sound money management.
Yeh, manually .. just follow the price action, the only guide You ever need, I dont use any indicators, I just mark up the interesting key levels/areas aka potential turning points and see how it reacts there - how much gas left? No need to physically "trail it" all the time also, just see when price starts building opposite LTF structure (starts breaking back minor highs/lows) then maybe move SL closer/behind structure/close trade and see if it wants to go lower/higher, does it have some momentum left? Is it getting exhausted? Maybe it just filled some imbalance back and now the drop is gonna begin? Are we consolidating now suddenly? But does the structure remain in our favor when we are consolidating/squeezing? Maybe it needs a bit more time? Drop base drop? Bigger breakout coming? Just read/follow price action, look at the candles on different timeframe, they are telling You something.. I dont always read it right, but atleast I try and I learn from mistakes and thats how you can proccess also when You see these things unfolding Yourself. Based on Your reply Your like asking for some kind of holy grail system..
If daytrading mostly and looking for a quick reaction from the market in specific times only then theres no harm in monitoring, most of the times quick scalps dont last very long and I like to see how the price moves as im gaining more experience.
Do make life easier then can set alerts, use 2 screens to do other stuff/work, no need to watch every candle always, but its good to mark zones where market might react off to, so You can take some profits off/see how the lower timeframe structure reacts, trail SL closer in these scenarios .. also market doesent care about my RR either.. Like .. I dont know for sure if its gonna go 1:10 or 1:2 .. I just have some ideas in mind based off experience.. so I usually have 2-3 targets in mind, sometimes only one easy target (e.g if trading bigger timeframe retracement back).. but only price will confirm further, so Im always prepeared to take what it wants to give me (constantly using both HTF + LTF together as a guide), adapting with the environment, never forcetrade or hopetrade something. If theres no setup or not deep enough pullback for me to enter then theres no trade as simple as it is. Theres alot of times that the limit orders dont get filled or trade ends up with breakeven and then theres alot of times it just keeps running further in profit when i already took the most of the profits off and its totally fine (its actually really good aslong as one is following the system) - buildup of more patience & discipline for future.
If theres emotion problem, like .. if it hurts (lol
) then theres only 2 solutions I can say based on my experience:
1) Lower the risk, have a risk management plan - risk only a certain precalculated % and $ that Youre willing to lose!
2) Gain more charttime/experience.
or probably both..
Before entering trade one should know/have precalculated how much they are already risking $$ wise, accept the risk/potential loss pretrade - removes fear aka emotion! Risk management calculator can help alot probably as its the only "indicator" I can suggest using, also reffered as (The Secret) - See here:
1) Lower the risk, have a risk management plan - risk only a certain precalculated % and $ that Youre willing to lose!
2) Gain more charttime/experience.
or probably both..
Before entering trade one should know/have precalculated how much they are already risking $$ wise, accept the risk/potential loss pretrade - removes fear aka emotion! Risk management calculator can help alot probably as its the only "indicator" I can suggest using, also reffered as (The Secret) - See here:
{quote} Added to Post # 1 Yes there is a secret trick ! but rarely people believe that it is the real secret. People think important is the method but it is not the method it is the secret + method without the secret no method will be successful. The Secret: what is the amount of $$ loss (not pips) we willing to lose from all our equity? what % it will be from our equity lost is the secret. Unfortunately we dont use SL and assume price has to respect my entry always. if you have the answer of above question, you will not need to ask how many pips...
Like think logical, if we place the SL above/under the assumed "Liquidity grab"/market structure then price shouldnt break it, if it does then its already shift/change in structure and we were wrong about it being a liquidity grab/stophunt anyway, so Your SL does the job for You .. so trust it. Losses are part of the game, gotta take them like a man. Theres always next day, next session and new opportunities, so why get emotional about one trade?
to finish things up..
And also dont neccessary follow my advice.. take everything with a grain of salt You see and/read and go backtest, forwardtest and see by Yourself how things work and take notes, see how You can actually trail and move the stops in certain sitatuions, whats the most logical/beneficial way for You that fits YOUR style? Yes I like to often ride that 1m structure, and scale in and out, but maybe You dont have time for that? Maybe its too complicated? Theres tons of information in those charts we have access to nowadays and ICT videos and thats one of the best things You can do! Just gotta put the work in - learn something, then see by yourself how it forms on live, practise it day in day out etc..
Feel free to build/develop Your own system that You like, only a certain type of price behaviour You wanna see, that You know that fits Your personality and only trade that what You can see, what might work for me might not suit for You.
ICT talked about Your "bread & butter" setup constantly in hes older videos thats uniquely Yours in its own way - once it clicks and once You find it/develop it further, then You only know what Youre looking for .. like you see it, its there and thats all You need, just 1 move Youre looking for and that 1 move can build Youre whole trading career! Be it OTE, Judas swing, higher timeframe breaker block setup, only a certain session liquidity grab followed by LTF BOS & retest, daily candle raid, LTF equal lows/high liquidity range setup, whatever it is. Go find it, backtest, forwardtest and make it uniquely Yours that You can follow and take without hesitation!
And also dont neccessary follow my advice.. take everything with a grain of salt You see and/read and go backtest, forwardtest and see by Yourself how things work and take notes, see how You can actually trail and move the stops in certain sitatuions, whats the most logical/beneficial way for You that fits YOUR style? Yes I like to often ride that 1m structure, and scale in and out, but maybe You dont have time for that? Maybe its too complicated? Theres tons of information in those charts we have access to nowadays and ICT videos and thats one of the best things You can do! Just gotta put the work in - learn something, then see by yourself how it forms on live, practise it day in day out etc..
Feel free to build/develop Your own system that You like, only a certain type of price behaviour You wanna see, that You know that fits Your personality and only trade that what You can see, what might work for me might not suit for You.
ICT talked about Your "bread & butter" setup constantly in hes older videos thats uniquely Yours in its own way - once it clicks and once You find it/develop it further, then You only know what Youre looking for .. like you see it, its there and thats all You need, just 1 move Youre looking for and that 1 move can build Youre whole trading career! Be it OTE, Judas swing, higher timeframe breaker block setup, only a certain session liquidity grab followed by LTF BOS & retest, daily candle raid, LTF equal lows/high liquidity range setup, whatever it is. Go find it, backtest, forwardtest and make it uniquely Yours that You can follow and take without hesitation!
To see what I am talking about requires you to spend some time on the charts, like I did, and look at the OB on the HTF and zoom into LTFs to see the BOS. I went further to also look at the tick charts.
How did I reach to the conclusion of the Order Block and Break of Structure?
I studied the BOS more on this thread (and other sources) and I was satisfied with it as a tool that I can use. As for the OB theory I knew it for a long time but I wasn't satisfied with it. I believe earlier on this thread I questioned the OB as a strong tool to use (as it is not respected at times). So I sat down and highlighted an OB where price returned to and respected it (on a HTF). Then I zoomed down to LTF to see what is happening around that OB and I took notes of what I saw. The obvious things I noted - liquidity grab (some), displacement, FVG, the BOS and where it happens (near Support/Resistance).
The first thing you need to understand is the meaning of an OB.
ICT defines a Bullish OB as:
1. The Lowest Candle or Price Bar with a Down Close (bearish);
2. That has the most range between Open and Close;
3. And is near a "Support" level.
He goes further and say its validation is when that Last Candle or Bar is traded through by a later formed Candle/Bar. In terms of Price Action you can see a breakout from that Last Candle/Bar (it doesn't have to be one opposite candle/bar - it can be many opposite candle/bars). You want to see a displacement that follows that Last Candle/Bar. In a BOS price breaks through the previous Low or High (a displacement).
Take this knowledge about the OB and combine it with the BOS that is explained on this thread and use the HTFs and LTFs to see my conclusion. Like I said even ICT briefly mentioned it on one of his series videos.
Bear in mind of the fractal nature of the market - a wave is subdivided into smaller waves and so on and so on. Also a Candle/Bar in HTF is is divided into candles/bars which can be seen in LTFs.
For an illustration just pick an OB in a HTF (preferably H1 and above) and show me the pair and time-frame and then I will break it down for you. I don't want to select an OB and show you the break-down to suit what I'm saying. Note if the OB candle/bar has a wick (and/or the candle prior) you are highly likely to see a BOS of the lower degree. So to make it harder for me choose an OB candle/bar (and prior candle/bar) with no wick for price to pass through. Why select from a HTF? I don't have past tick data to break it down any further below M1.
The best way for you to see all of this is through spending some time on the charts (research and practice, practice, practice). Always bear in mind of the fractal nature of the market.
How did I reach to the conclusion of the Order Block and Break of Structure?
I studied the BOS more on this thread (and other sources) and I was satisfied with it as a tool that I can use. As for the OB theory I knew it for a long time but I wasn't satisfied with it. I believe earlier on this thread I questioned the OB as a strong tool to use (as it is not respected at times). So I sat down and highlighted an OB where price returned to and respected it (on a HTF). Then I zoomed down to LTF to see what is happening around that OB and I took notes of what I saw. The obvious things I noted - liquidity grab (some), displacement, FVG, the BOS and where it happens (near Support/Resistance).
The first thing you need to understand is the meaning of an OB.
ICT defines a Bullish OB as:
1. The Lowest Candle or Price Bar with a Down Close (bearish);
2. That has the most range between Open and Close;
3. And is near a "Support" level.
He goes further and say its validation is when that Last Candle or Bar is traded through by a later formed Candle/Bar. In terms of Price Action you can see a breakout from that Last Candle/Bar (it doesn't have to be one opposite candle/bar - it can be many opposite candle/bars). You want to see a displacement that follows that Last Candle/Bar. In a BOS price breaks through the previous Low or High (a displacement).
Take this knowledge about the OB and combine it with the BOS that is explained on this thread and use the HTFs and LTFs to see my conclusion. Like I said even ICT briefly mentioned it on one of his series videos.
Bear in mind of the fractal nature of the market - a wave is subdivided into smaller waves and so on and so on. Also a Candle/Bar in HTF is is divided into candles/bars which can be seen in LTFs.
For an illustration just pick an OB in a HTF (preferably H1 and above) and show me the pair and time-frame and then I will break it down for you. I don't want to select an OB and show you the break-down to suit what I'm saying. Note if the OB candle/bar has a wick (and/or the candle prior) you are highly likely to see a BOS of the lower degree. So to make it harder for me choose an OB candle/bar (and prior candle/bar) with no wick for price to pass through. Why select from a HTF? I don't have past tick data to break it down any further below M1.
The best way for you to see all of this is through spending some time on the charts (research and practice, practice, practice). Always bear in mind of the fractal nature of the market.
There are many ways to draw OBs and to refine them to lower timeframes. It comes to you to decide how to do it, some people prefer to draw only the first OB that gave life the other OB before the BOS, some people choose the last OB before the BOS.
What you drew are different OB on different timeframes, which are all correct, but the fact that they're correct doesn't mean that they have to be respected. Personally I use the first OB that gave life to the other OB before the BOS also called Origin. I will show you how I do my analysis on GOLD, usually I start from the daily and I don't look at 4h, from the daily I look at the 1h.
From here of course you can go on even lower timeframes, 15min, 5min, whatever you like. Personally I use the 15min/5min for intraday trades while trades I take on the 1h I plan to hold them for a few days.
My point is that you don't have to use every timeframe, I use the Daily and the 1h or 15min/5min, you can use whatever suits you, D and 1h, 4h and 15min, 1h and 5min/1min whatever, but marking every ob on every timeframe won't bring you anywhere.
Often price won't reach your OBs, but it's part of trading, you don't want to chase price, you let it come to you. This doesn't mean you can't take continuation trades if price misses your wanted entry of course, as Bilal often showed he takes continuation trades too if price doesn't touch his levels.
My advice for you is, decide what you want to focus on right now:
-scalping(a few hours)
-short-term trading(a few days)
-swing trading(a few weeks)
-position trading(a few months)
Choose 3 timeframes:
-one for long term perspective
-one for medium term perspective
-one for short term perspective/entries
For example if you want to scalp you can use 4h for long term perspective, 1h for medium term perspective and 15min/5min for short term perspective/entries.
Or you can use 1h for long term perspective, 15 min for medium term perspective and 1min for short term perspective/entries. It's up to you to find what you find yo work and what not.
My point is that you don't have to use every timeframe, I use the Daily and the 1h or 15min/5min, you can use whatever suits you, D and 1h, 4h and 15min, 1h and 5min/1min whatever, but marking every ob on every timeframe won't bring you anywhere.
Often price won't reach your OBs, but it's part of trading, you don't want to chase price, you let it come to you. This doesn't mean you can't take continuation trades if price misses your wanted entry of course, as Bilal often showed he takes continuation trades too if price doesn't touch his levels.
My advice for you is, decide what you want to focus on right now:
-scalping(a few hours)
-short-term trading(a few days)
-swing trading(a few weeks)
-position trading(a few months)
Choose 3 timeframes:
-one for long term perspective
-one for medium term perspective
-one for short term perspective/entries
For example if you want to scalp you can use 4h for long term perspective, 1h for medium term perspective and 15min/5min for short term perspective/entries.
Or you can use 1h for long term perspective, 15 min for medium term perspective and 1min for short term perspective/entries. It's up to you to find what you find yo work and what not.
It is not necessary to mark a daily candle and inside that h4, and H1 then m30 till m1
Simplest is mark htf only and wait price to reach there and see the reaction and capitalize it. I.e, weekly, daily, h4 or m15 choose any one you like.
What you have to mark:
- imbalances as price comes back to rebalance them, wait for a bos and return to ob is entry
- Order blocks, breaker blocks, as price sweeps them for Liquidity, but when respects wait for a bos and retrum to ob is entry (then price creates new imbalances)
the statement was not complete.
then it becomes trading is simple but not easy.
yet why they still keep on saying keep it simple, keep it simple.
how simple can you get?
then ict concept solved most of the puzzles of being simple.
trade by just drawing lines and boxes.
instead of trading from top to bottom, bottom to top,
now i trade from liquidity to fvg or liquidity (on htf), and from fvg to liquidity or fvg (on ltf)
but it is still not easy.
at least now it is less complex.\
then it becomes trading is simple but not easy.
yet why they still keep on saying keep it simple, keep it simple.
how simple can you get?
then ict concept solved most of the puzzles of being simple.
trade by just drawing lines and boxes.
instead of trading from top to bottom, bottom to top,
now i trade from liquidity to fvg or liquidity (on htf), and from fvg to liquidity or fvg (on ltf)
but it is still not easy.
at least now it is less complex.\
the mistake is: time of day
you traded what ict asked you not to. new york lunch time,
you would have won if you traded the ny exch open.
Whatever plan you are trying to build, you scale it down to the most basic.
Show up at the Time of Day (London Open or New York Open) no matter how little time is available.
To most people it is kind of ridiculous and time wasting.
The point is you are mastering the art of showing up.
A habit has to be established before it can be improved.
Until you become the person who shows up everyday, there is nothing to optimize.
We are so worried about figuring out and searched for the 'perfect' plan, but we don't do the thing that is fundamental to it all.
Which is just showing up.
Show up at the Time of Day (London Open or New York Open) no matter how little time is available.
To most people it is kind of ridiculous and time wasting.
The point is you are mastering the art of showing up.
A habit has to be established before it can be improved.
Until you become the person who shows up everyday, there is nothing to optimize.
We are so worried about figuring out and searched for the 'perfect' plan, but we don't do the thing that is fundamental to it all.
Which is just showing up.
per ICT, use D1, H1, M15 for directional bias, structure and framework for entries.
M5,4,3,2,1 for trade execution.
everyday all you need to do is to ask: where is price going to gravitate to?
only 2 places: bouncing between liquidity stop and fair value gap, vice versa.
take profit can be at fair value gap or liquidity stop.
time of day to trade: around london open and/or new york open.
that's it in a nutshell.
M5,4,3,2,1 for trade execution.
everyday all you need to do is to ask: where is price going to gravitate to?
only 2 places: bouncing between liquidity stop and fair value gap, vice versa.
take profit can be at fair value gap or liquidity stop.
time of day to trade: around london open and/or new york open.
that's it in a nutshell.
we must need FVG to enter in trade
you found h4 fvg
do the same in lower time frames.
you have to see:
1. liquidity stop
2. displacement and/or market structure shift
3. fvg
there was no set up in m15, just consolidation near h4 fvg.
below that, there was one set up.
go to more lower time frames to find one in m5,4,3,2,1.
do the same in lower time frames.
you have to see:
1. liquidity stop
2. displacement and/or market structure shift
3. fvg
there was no set up in m15, just consolidation near h4 fvg.
below that, there was one set up.
go to more lower time frames to find one in m5,4,3,2,1.
there are 2 fvg with the ob.
it's up to individual where to put through the trade.
the upper or the lower fvg, or the ob.
if sell at lower fvg or the lower part of ob, then be prepared that price could go up to the higher fvg.
if wait to sell at higher fvg, price may not even reach there.
all in all, i see the ob as a zone, with the fvg which can indicate that it is quite a solid resistance zone.
if not sure, when price return there, just wait for liquidity stop taken, displacement, fvg to form.
it's up to individual where to put through the trade.
the upper or the lower fvg, or the ob.
if sell at lower fvg or the lower part of ob, then be prepared that price could go up to the higher fvg.
if wait to sell at higher fvg, price may not even reach there.
all in all, i see the ob as a zone, with the fvg which can indicate that it is quite a solid resistance zone.
if not sure, when price return there, just wait for liquidity stop taken, displacement, fvg to form.
Remember market only does two things at all time frames
1. takes out liquidity
2. Fill the imbalance
1. takes out liquidity
2. Fill the imbalance
Pick:
1) One model/pattern
2) One pair
3) One session/killzone
And thats all You need.
Show up every day at that exact same time window - now You developed a good habit. Usually theres nearly every session something to work with.
Can be even as little as 1-2 hours per day (which can be enough to even catch most of the daily range very often). Soon You start seeing everyday the same price behaviour/things Youve already have experienced.
And then You can start taking Your shots - like a sniper!
Looking back at my own trading history - every time i changed one of these 3 things my accuarcy & RR took a hit as my focus wides away when "multitasking". So why change the working system?
I actually honestly believe that 80-90%+ accuarcy with a decent (atleast 1:2/1:3RR+) is achieveable if one really puts in the time, takes only Your "Best trading setups" as hes actually teaching how and why price moves. Most of the times when we are wrong its usually we read it wrong/tunnel vision/get emotional/ignore risk parameters, not that there is something wrong with the system as the "system" is the price afterall.
As one is progressing then can always keep educating himself if neccesary or preferably find info only about Your favorite certain thing/model/pair/session that You wanna practise to develop the game plan even better. Gather as much as possible about that 1 thing You like/believe in, theres so much valuable stuff around.
Life changing!
Subscribe to:
Posts (Atom)